PEFT-SP
Signal peptide prediction tool using protein large language model (PLM)
Status
| ID | Job Nickname | Submitted Time (Local) | Progress |
|---|
Downloads
Papers:- Zeng, Shuai, Duolin Wang, and Dong Xu. "PEFT-SP: Parameter-Efficient Fine-Tuning on Large Protein Language Models Improves Signal Peptide Prediction." bioRxiv (2023): 2023-11. (Preview)
- Zeng, Shuai, Duolin Wang, Lei Jiang, and Dong Xu. "Prompt-Based Learning on Large Protein Language Models Improves Signal Peptide Prediction." In International Conference on Research in Computational Molecular Biology, pp. 400-405. Cham: Springer Nature Switzerland, 2024.
Instructions
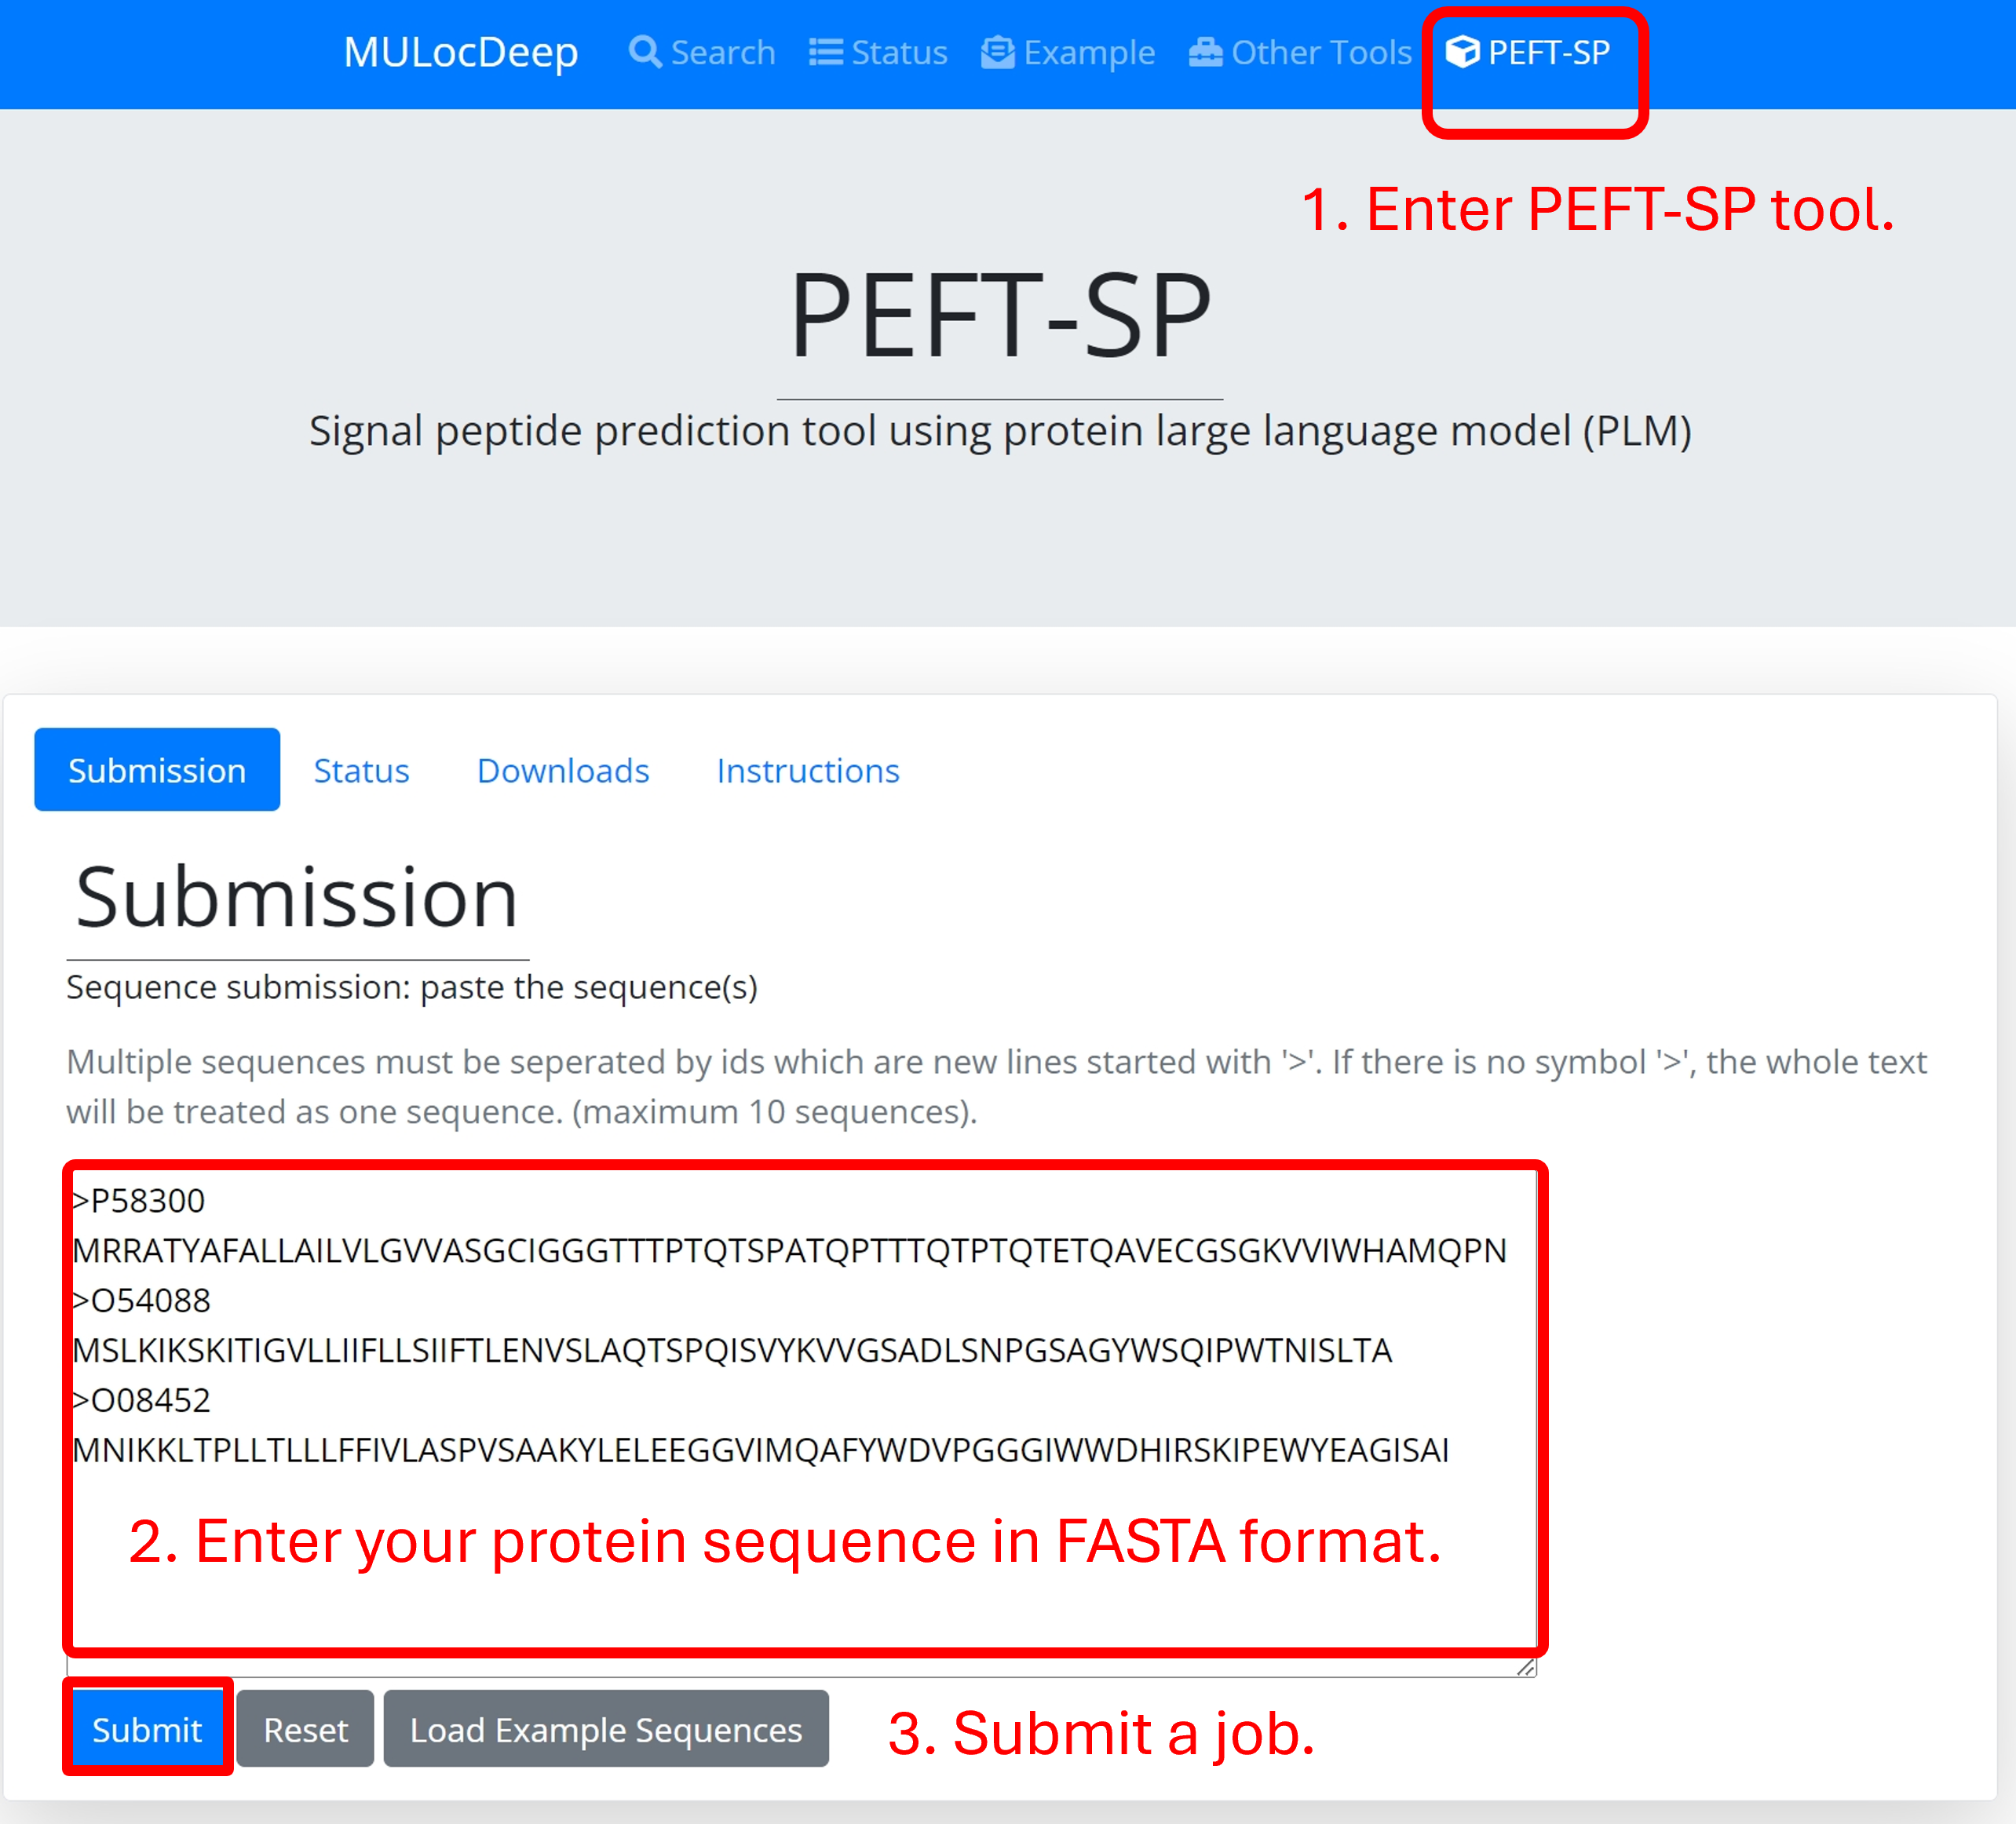
Example to submit a job:
1. Enter PEFT-SP tool (you are here).
2. Enter protein sequences in FASTA format in the text area.
3. Click on the "Submit" button.

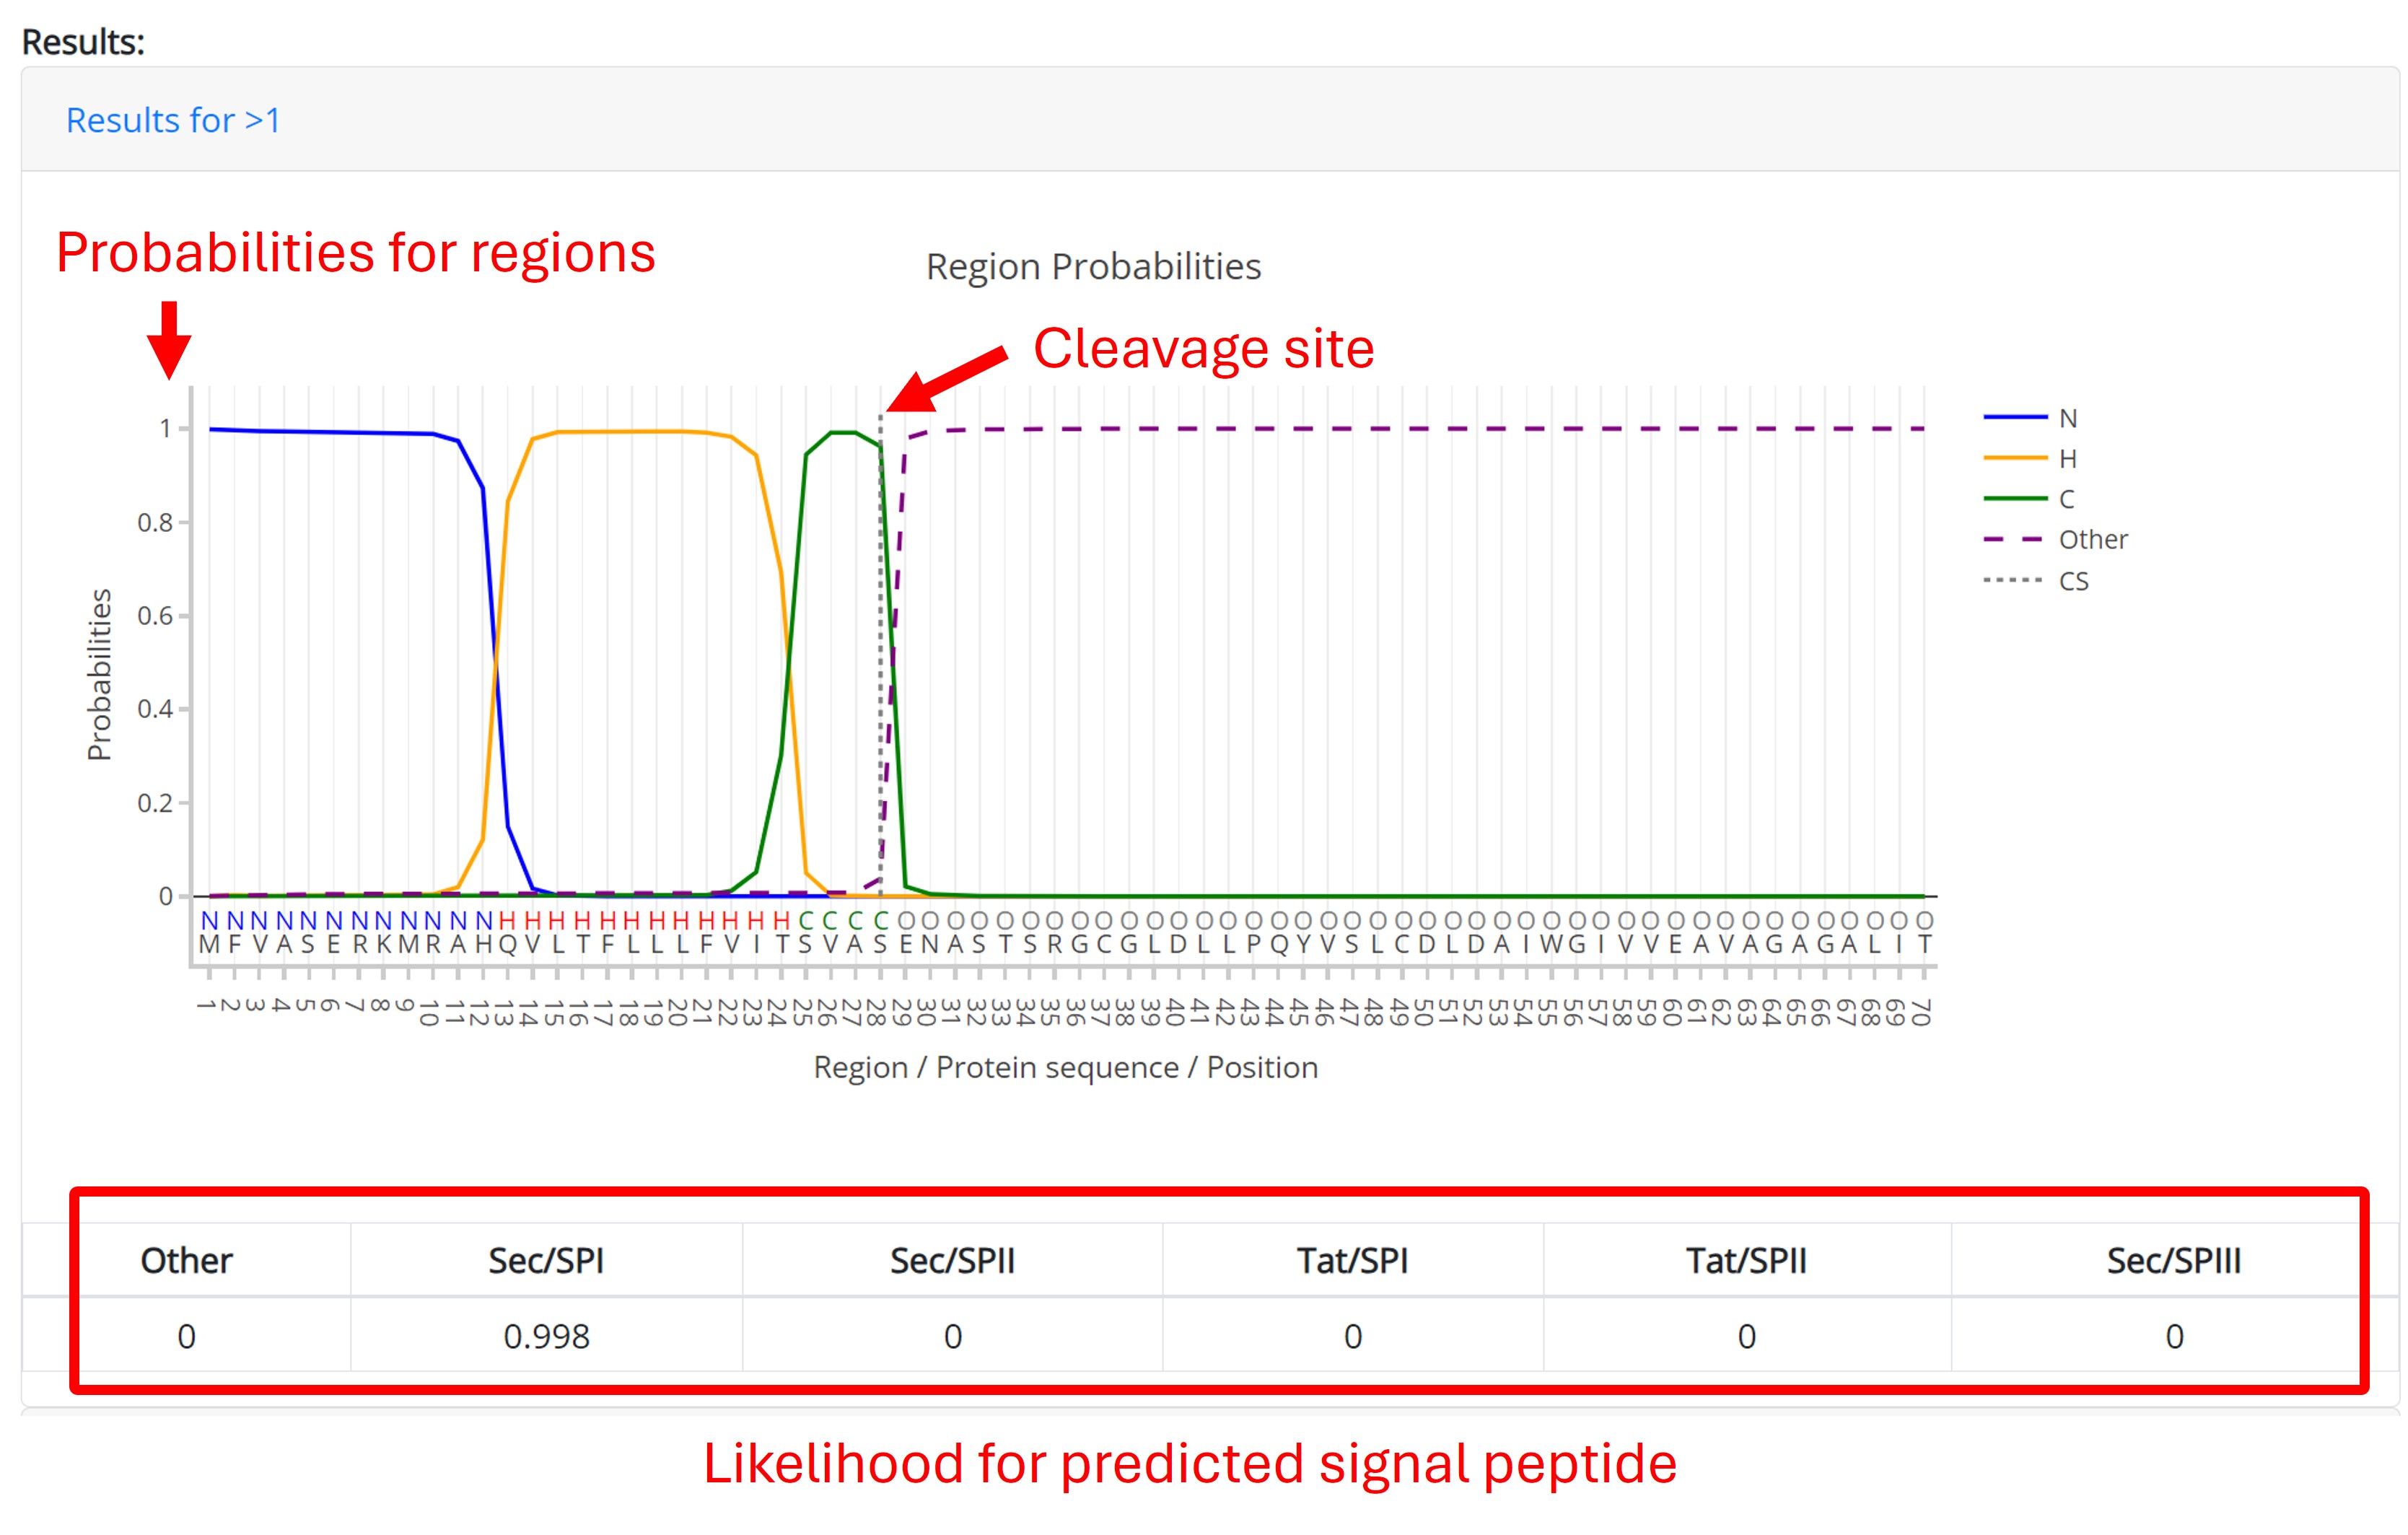
Example outputs:
The example below shows the output for protein with Sec signal peptide. The table shows likelihood of predicted signal peptide. The predicted signal peptide is one of follow:
- Sec signal peptide (Sec/SPI)
- Lipoprotein signal peptide (Sec/SPII)
- Tat signal peptide (Tat/SPI)
- Tat lipoprotein signal peptide (Tat/SPII)
- Pilin signal peptide (Sec/SPIII)
- No signal peptide at all (Other)
If a signal peptide is predicted, the cleavage site position is shown as a vertical line in the plot. The positions of the following regions are predicted by the model:
- n-region: The basic region in N-terminal of the signal peptide for Sec/SPI, Sec/SPII, Tat/SPI, and Tat/SPII. Regions are labeled as N.
- h-region: The hydrophobic region of the signal peptide for Sec/SPI, Sec/SPII, Tat/SPI and Tat/SPII. Regions are labeled as H.
- c-region: The polar region in C-terminal region of the signal peptide for Sec/SPI and Tat/SPI. Regions are labeled as C.
- Twin-arginine motif: The twin-arginine (R-R) motif at the end of the N-region for Tat signal peptides. Regions are labeled as R.
- Sec/SPIII: These signal peptides have no known region structure.
